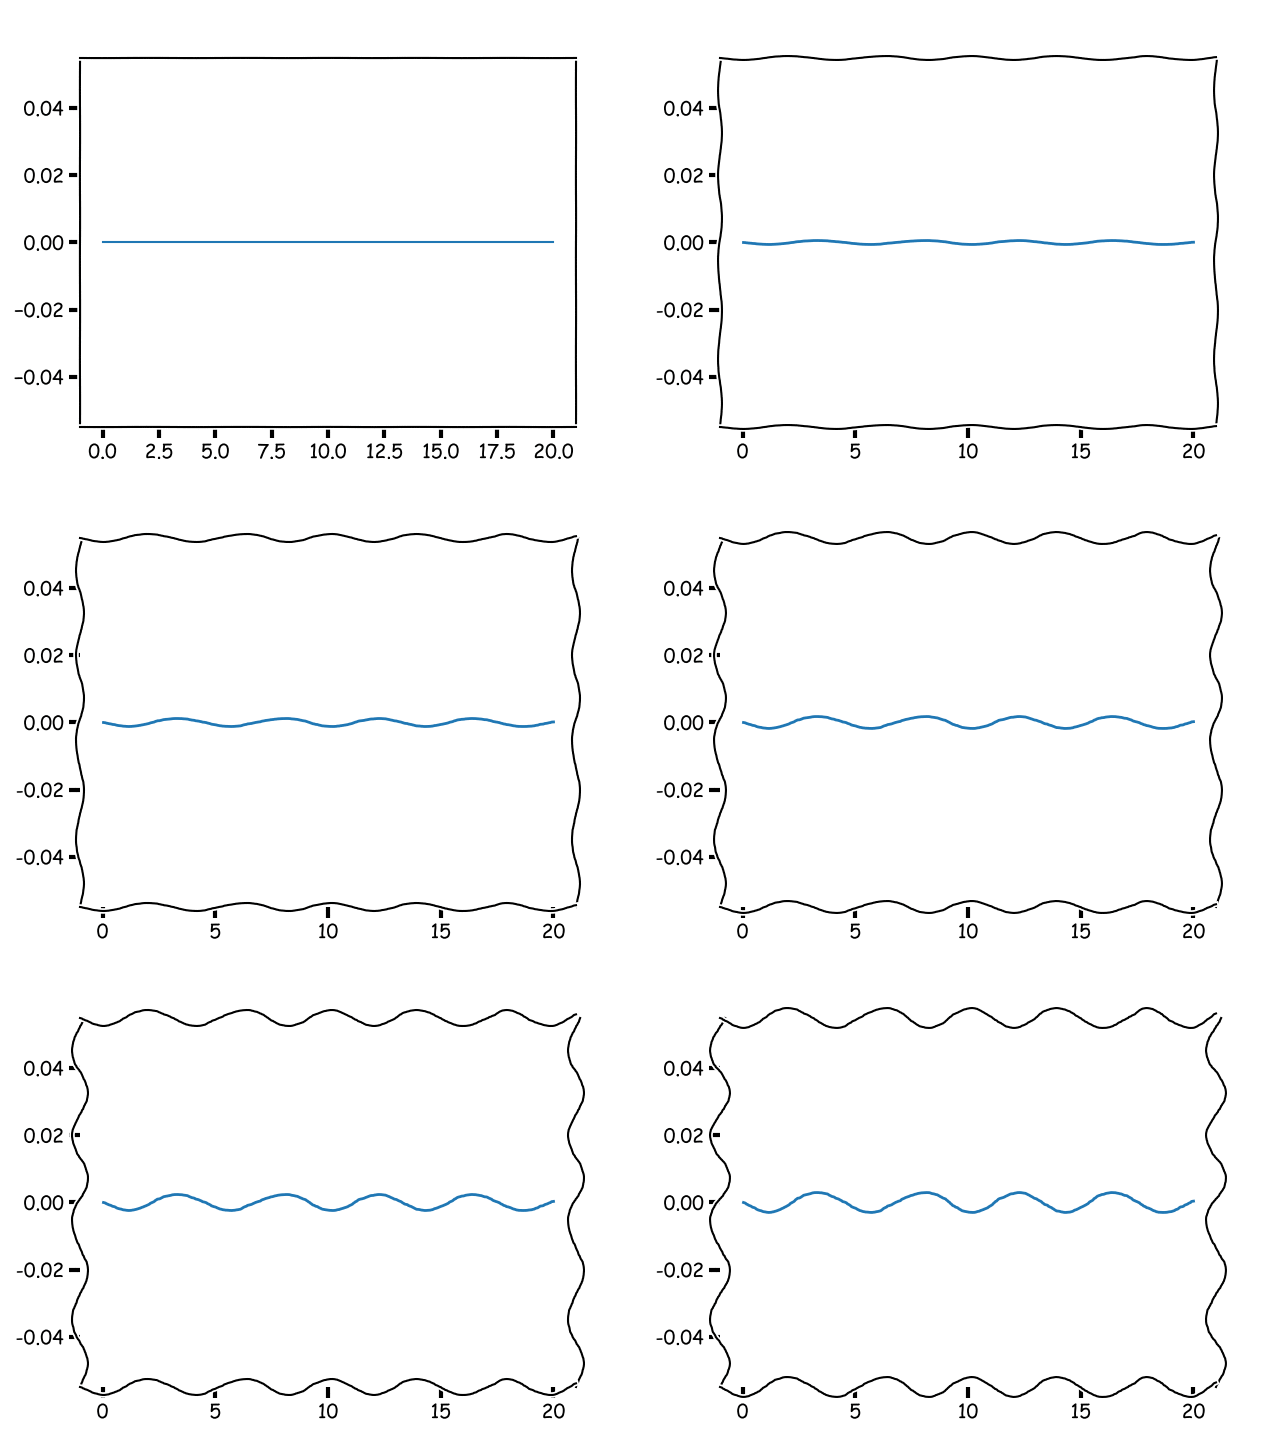
I started to learn Julia for various reasons. I stumbled across the JuliaBox tutorials by Huda Nassar. Her introduction to data science with Julia contains the xkcd plot style. Do you know https://xkcd.com/? It is basically a collection of cartoons. I think it is a good way to produce more realistic seismic plots for earthquake situations. Traditional plots are quite boring unless we are into geophysics. It is time to make them look a bit more realistic ;).
import PyPlot
x = collect(0:0.5:20)
y = zeros(size(x))

for i=0:0.07:10
    PyPlot.xkcd(scale=i)
    fig = PyPlot.figure()
    plot = PyPlot.plot(x,y)
    PyPlot.savefig("./plots/earthquake_timestep_$i.png", dpi=100)
end
We can use ImageMagick to create an animated gif:
convert -delay 20 -loop 0 *.png plot.gif
