Contents
This little model comparison lead to writing and publishing this paper in which we compare more than just YOLO models .
last update: 2020-06-14
Experimental setup
All networks use an input resolution of 608x608. This is the only parameter changed (for YOLOv2, YOLOv2-tiny, YOLOv3, YOLOv3-spp, YOLOv3-tiny), all other parameters remain as provided in the original files. As GPU a RTX 2060 Super was used.
Since I’m not interested in standard metrics provided by the test server, I have to use the *validation set here.
The setup of darknet is straight forward. All experiments are run as follows (with and without float16 support):
./darknet detector valid cfg/coco.data cfg/yolov4.cfg weights/yolov4.weights
This will create a json file in ./results/ containing the predictions. The default filename is coco_results.json.
General overview
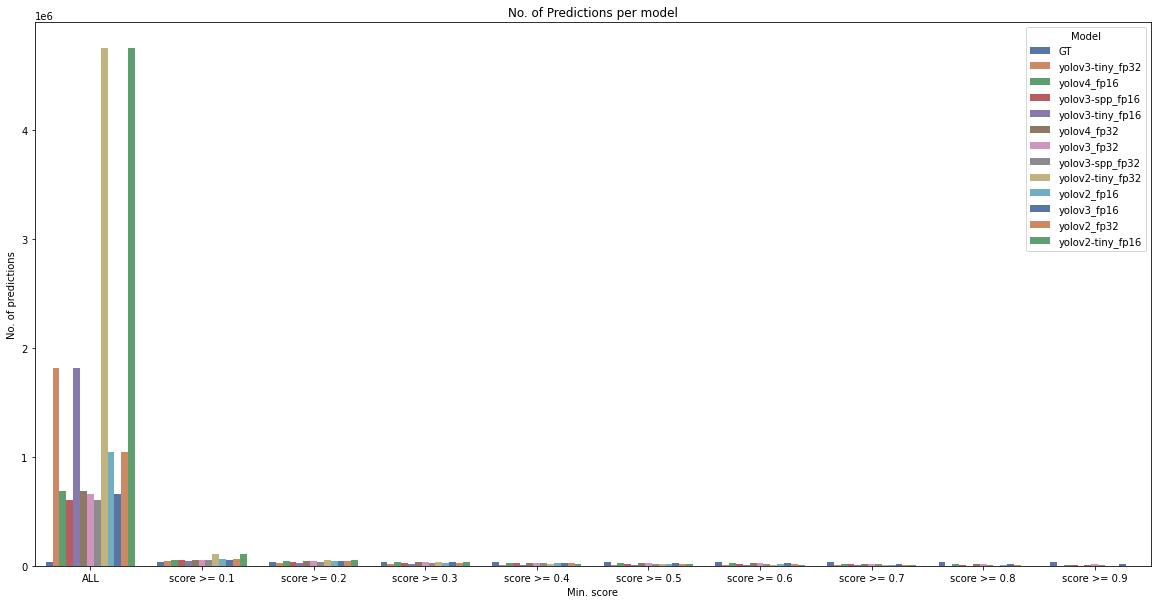
First, we have to remind ourselves what is actually compared in most metrics. In this case, we’ll look at the best IoU score, for various confidence levels (score). This also means, that we might get multiple predictions for each reference annotation (GT). If we don’t filter by score, we will get a ton of predictions (correct class & IoU >0):
Let’s zoom in on predictions with a score of at least 0.1:
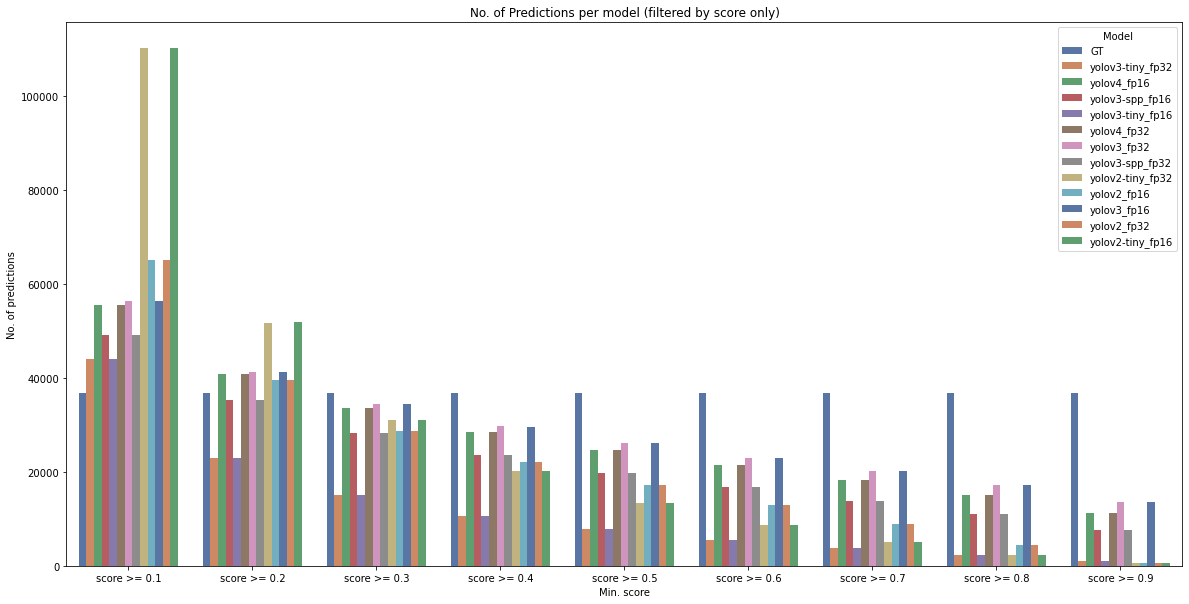
With score >= 0.1, we still get many more predictions than ground truth reference annotations. This kind of changes when we are interested in min. scores >0.3. What can we learn from this? Well, most models are trained for a min. score of 0.2, and it gets quite visible here.
Comparing all models
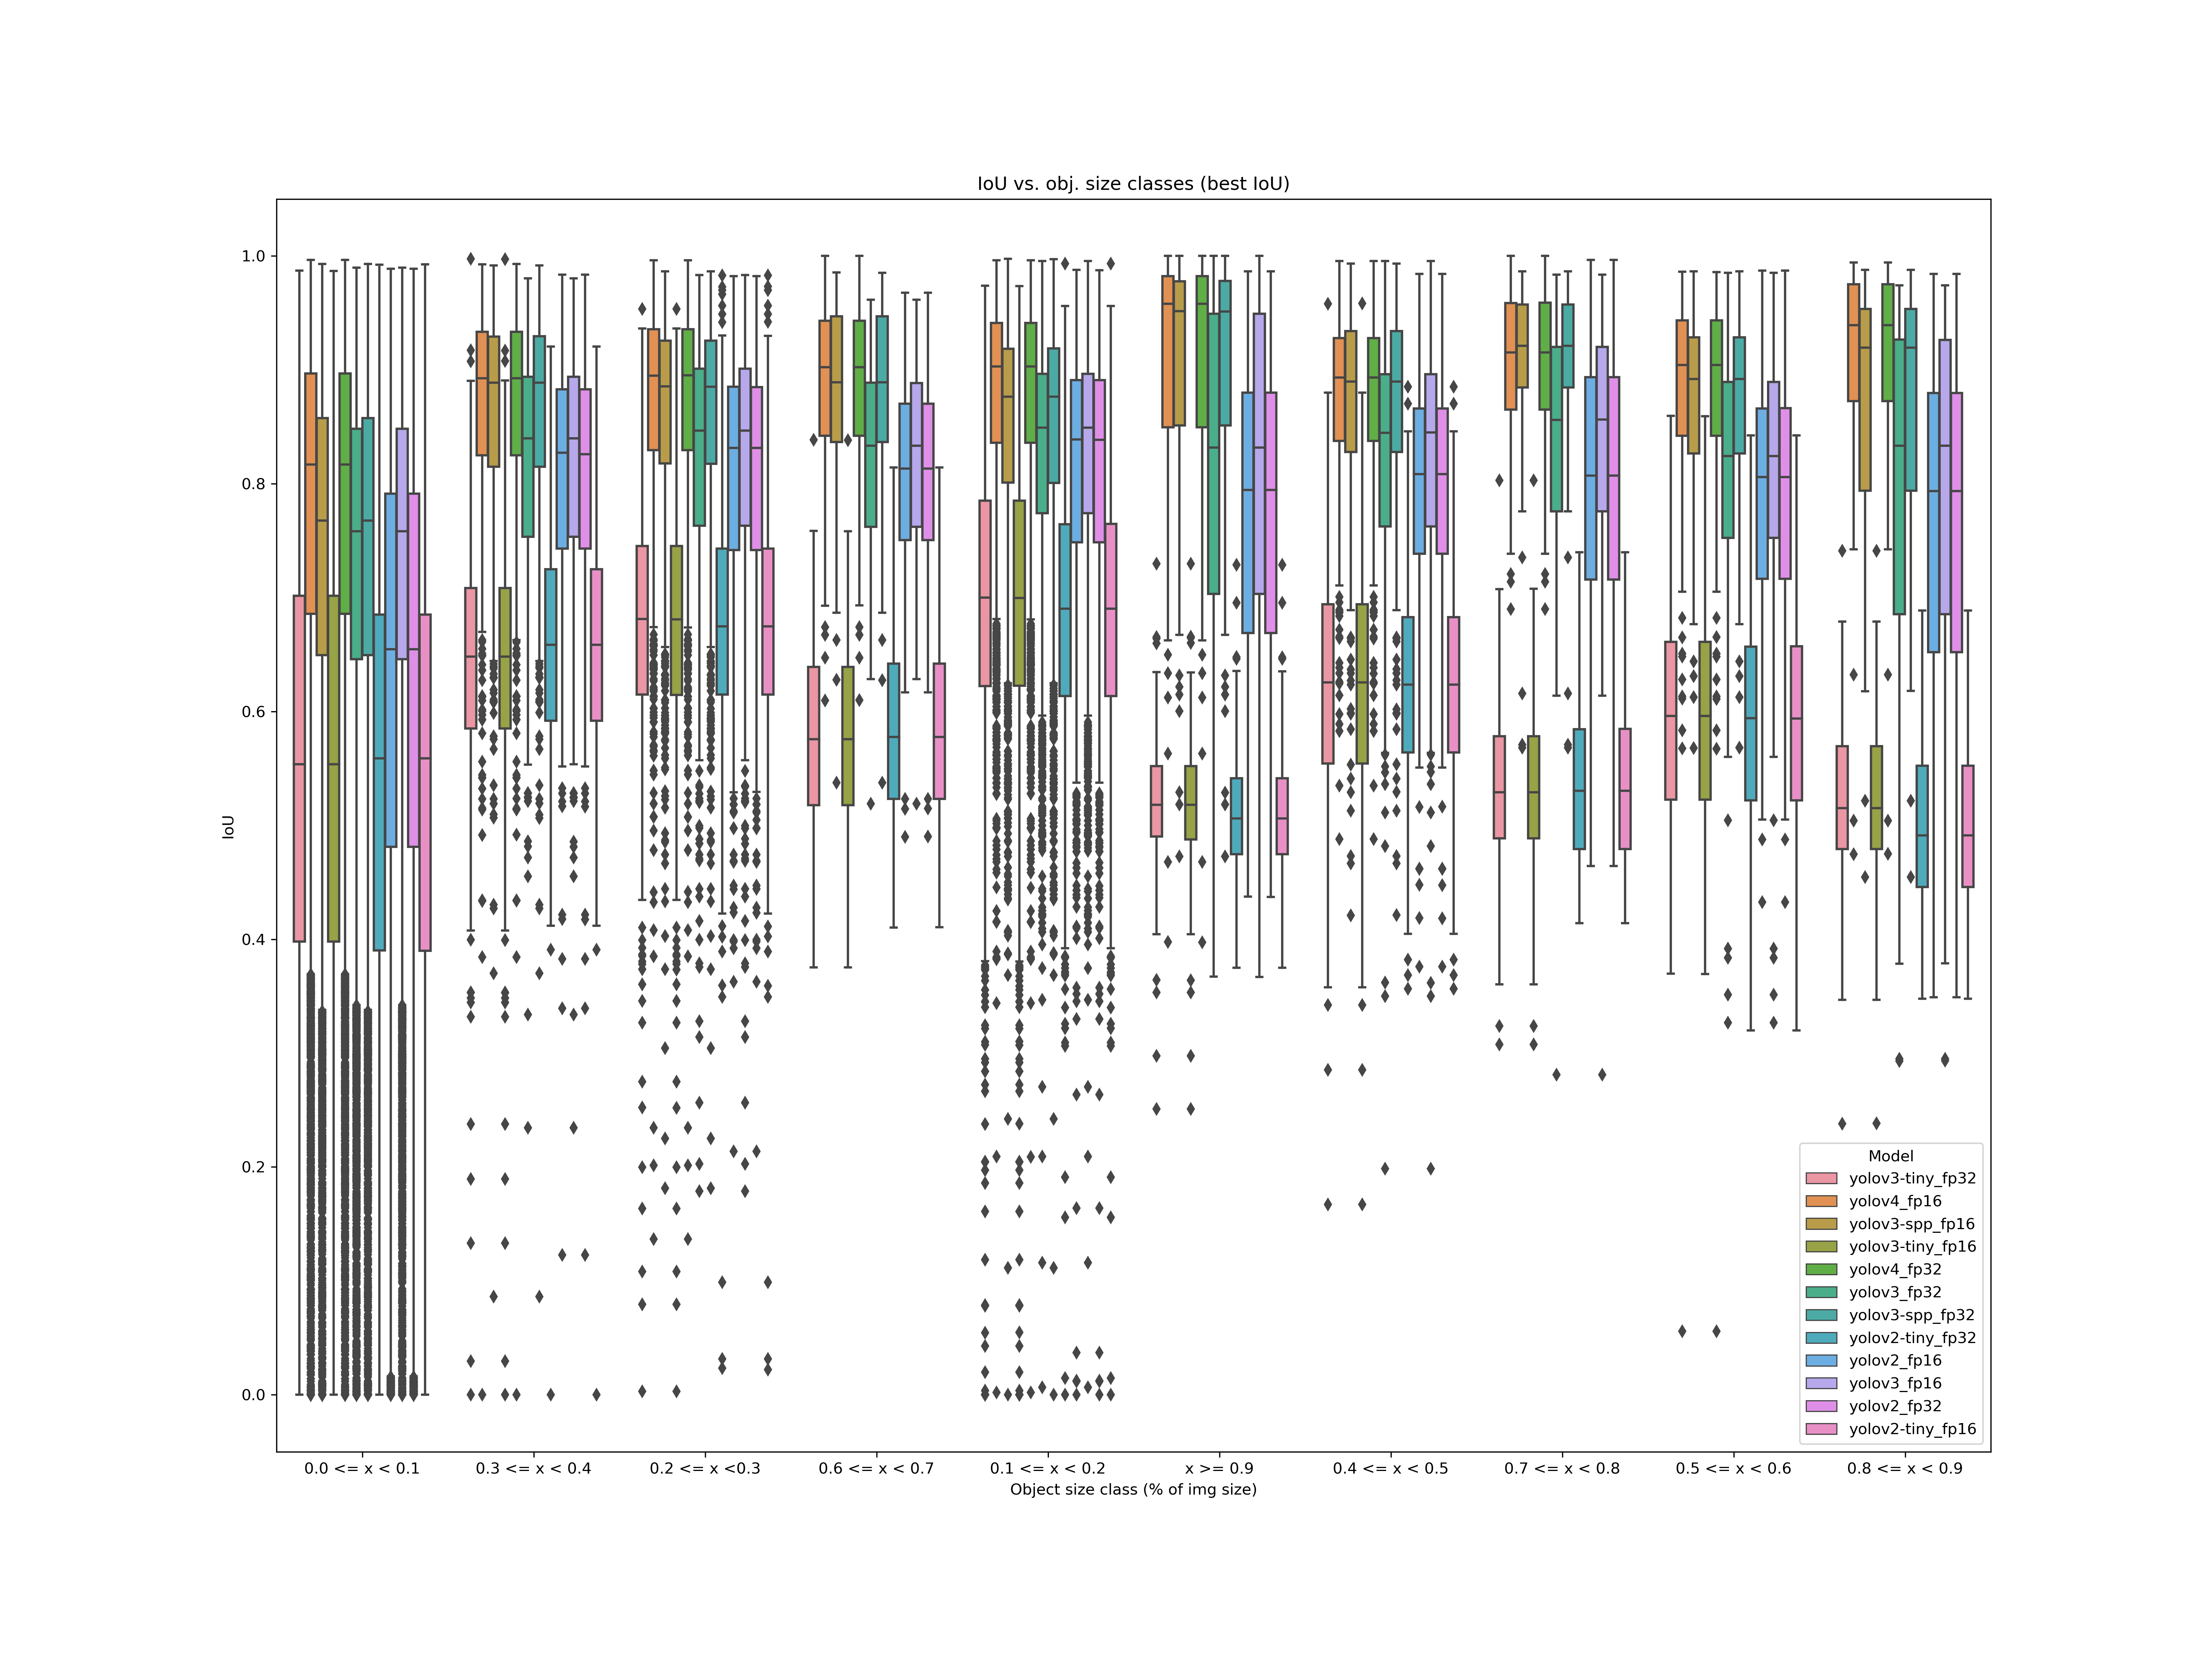
So, let’s have a look at how each model compares to other. To do so, we’ll see how they compare in terms of best IoU given a score threshold in comparison to relative object size in an image.
Please look at the x-axis. Seaborn seemed to swap placed of categories at some point, and I’m not up for writing a separate plot script for it ;)
The first finding is that the performance of YOLOv4 and YOLOv3-spp performs similarly. While the overall performance of YOLOv4 is better on small objects, it is the other way around for “mid-sized” objects. We can also see that most “tiny models” are somewhat low performing (I recommend using vovnet structures instead).
Quick look at YOLOv4 (fp16)
This is how it looks in detail for a single model in a less generalized way:

Final words
I hope I could inspire you to look at metrics a tiny bit different than what is usually shown in academic papers.