Contents
Introduction to Argoverse
Argoverse is a dataset that originates from self-driving test drives by Argo AI. It is a subset curated by Chang et al. 2019 for the purpose of accelerating R&D of 3D tracking and motion forecasting. Let’s have a look at it. It was recorded in Miami (204 km) and Pittsburgh (86 km) and can be divided into two subsets. Subset one contains 327793 vehicle trajectories (csv files) and subset two contains 113 scenes of 3D tracking annotations, 3D point clouds from a long-range LiDAR (10 Hz sample rate), a set of front-facing stereo cameras (5 Hz sample rate) and a ring of seven cameras to create a 360 degree view which is sampled at 30 Hz. Further, the dataset contains two (HD) maps of the areas driven.
The dataset is released under the CC BY-NC-SA 4.0 license. Parts of the HD maps are based on openstreet map and are licensed accordingly.
LiDAR sensors
The dataset contains a point cloud that was derived from two LiDARs on a vehicle. They have an overlap and a combined field of view of 40 degrees and a range of 200 m. LiDAR data is sampled at 10 Hz. There is some calibration data available for LiDAR (and cameras), however I haven’t looked into it so far.
Camera setup
The camera setup is straight forward. They used a fron-facing stereo camera (5 Hz sample rate) and seven cameras (ring cameras) for a 360 degree view sampled at 30 Hz (=fps).
Missing sensors and sensor data
The first thing I notice is that some crutial data is missing:
- IMU records
- GPS records
- RADAR sensor.
Localization data is available from sensor fusion (incl. GPS) but not the sensor data itself. To my mind, the most surprising thing missing is that RADAR sensors are missing. First, they are really cheap and pretty much every emergency breaking assistant uses it. Secondly, this means that this is some kind of a “nice weather setup” and certainly nothing that could be suitable for gravel roads (IMHO).
Forecasting
This is probably the most interesting part of the dataset. While there are many datasets out there that could be used to train an object classifier and tracking algorithm, there are very few datasets that focus on predicting someones actions. NB!. I haven’t looked to deep into the data to see if we can use the tracking data for this as well. However, we have to remember that other agents behavior depends on the setting on the street (e.g. an obstacle) and more importantly it is actively influenced by our own actions.
Let’s have a quick look at the sample forecasts:
import numpy as np
import matplotlib.pyplot as plt
from argoverse.data_loading.argoverse_forecasting_loader import ArgoverseForecastingLoader
from argoverse.visualization.visualize_sequences import viz_sequence

dataPath = "./data/forecasting/sample/data"
afl = ArgoverseForecastingLoader(dataPath)
for i in afl:
    print(i)
Seq : ./data/forecasting/sample/data/2645.csv
        ----------------------
        || City: MIA
        || # Tracks: 24
        ----------------------
Seq : ./data/forecasting/sample/data/3861.csv
        ----------------------
        || City: PIT
        || # Tracks: 5
        ----------------------
Seq : ./data/forecasting/sample/data/3828.csv
        ----------------------
        || City: MIA
        || # Tracks: 45
        ----------------------
Seq : ./data/forecasting/sample/data/4791.csv
        ----------------------
        || City: MIA
        || # Tracks: 60
        ----------------------
Seq : ./data/forecasting/sample/data/3700.csv
        ----------------------
        || City: PIT
        || # Tracks: 32
        ----------------------
Let’s visualize these trajectories using our standard plotting toolkit. We can access the trajectory coordinates by using .agent_traj.
plt.figure(figsize=(10,15))
for i in range(len(afl)):
    plt.subplot((len(afl)//2)+1,len(afl)//2,i+1)
    plt.scatter(afl[i].agent_traj[:,0],afl[i].agent_traj[:,1], color="black")
    plt.title("Forecasting sample "+str(i)+" trajectory")
    plt.xlabel("x coordinate")
    plt.ylabel("y coordinate")
    plt.axis("equal")
plt.show()

Well, it seems like the trajectory looks correct. However, if we inspect .seq_df, then we will find different OBJECT_TYPE entires: ['AV', 'OTHERS', 'AGENT']. The paper states that the forecasts contain 5 seconds in the sample, train, valid sets and 2 seconds sequences to predict the following 3 seconds in the test set. Therefore, we can assume that the annotations are irrelevant. However, let’s check if the on-board visualization tools provide a different understanding.
from argoverse.visualization.visualize_sequences import viz_sequence
seq_path0 = "./data/forecasting/sample/data/2645.csv"
viz_sequence(afl.get(seq_path0).seq_df, show=True)
seq_path1 = "./data/forecasting/sample/data/3861.csv"
viz_sequence(afl.get(seq_path1).seq_df, show=True)
seq_path2 = "./data/forecasting/sample/data/3828.csv"
viz_sequence(afl.get(seq_path2).seq_df, show=True)
seq_path3 = "./data/forecasting/sample/data/4791.csv"
viz_sequence(afl.get(seq_path3).seq_df, show=True)
seq_path4 = "./data/forecasting/sample/data/3700.csv"
viz_sequence(afl.get(seq_path4).seq_df, show=True)


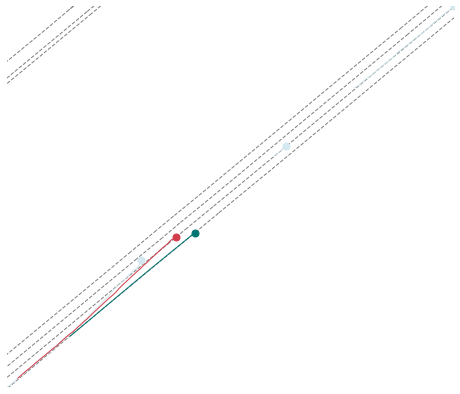
Unfortunately, the maps above come without a legend and the docstring of the function that creates them is not very helpful (and no, I’m not digging into the code for this).
Signature:
viz_sequence(
    df: pandas.core.frame.DataFrame,
    lane_centerlines: Union[numpy.ndarray, NoneType] = None,
    show: bool = True,
    smoothen: bool = False,
) -> None
I’m going to test a few algorithms on the forecasting dataset. First, because it is an interesting timeseries problem. Second, because “why not” ;).
In terms of real-world applications, it remains a question how the trajectories were derived and how accurate they are. This is simply something that we have to remember.
3D tracking
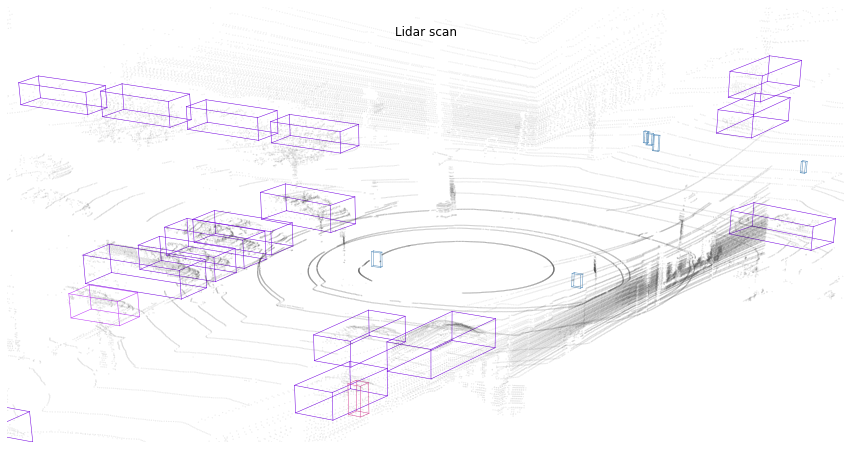
The second part of this dataset is more tricky. There are some tutorials on how to visualize this part of the dataset. However, API and dataset documentation sucks. Just looking at the raw data seems to be easier than using the API (in particular for everyone who worked with PCL, ROS, OpenCV, etc.). If we follow this tutorial, then we’ll end up with such a point cloud image:

It is possible to project LiDAR measurements on images (synchronized):

Further, there are some tutorials on map visualization and information extraction from them. However, I haven’t really made up my mind if that is useful or not. Also, I didn’t digged too deep into it.